


Source: Nasa
Where the polar lights occur
Polar lights, most often called 'aurora's', are natural light displays that occur in the polar regions at the northern and the southern hemisphere. At the northern hemisphere the polar light is called 'aurora borealis' or northern lights, and consequently at the southern hemisphere these lights are called 'aurora australis', or southern lights. 'Australis' is the latin word for 'of the south'. The polar lights often occurs between the 65-72 degrees north and south latitudes. During high activity of the polar lights, these lights can also be observed at lower latitutes and closer to the poles.
When the polar lights appear
The polar lights display during the entire year. However, most activity can be expected around the equinox - two times a year when the night and day are about equally long. At these days the earth rotation axis is oriented relative to the sun in a way that the position of the earth magnetic field is most favorable to direct the geomagnetic energie that is radiated away from the sun, towards the earth's poles. The polar lights occur during the night as well as during the day. However, they are only visible during the evening and night as the sunlight during the day 'blanks' them out.
Source: Ref1
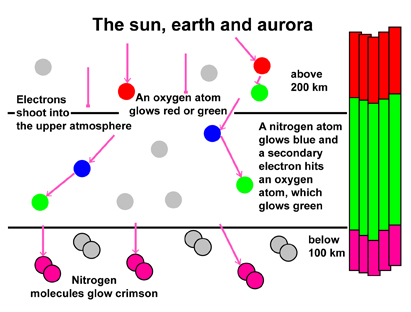
How the polar lights are formed
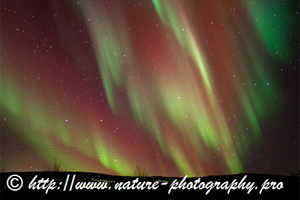
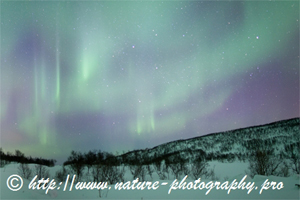
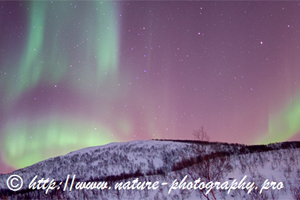
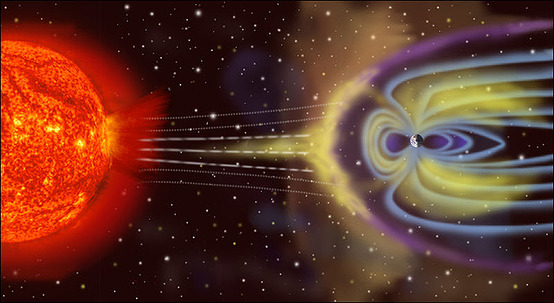
The polar lights are being formed in the earth's upper atmosphere, above the 80 km's and up into the ionosphere. Geomagnetic energie that is radiated from the sun and enters the earth's atmosphere interacts at these heights with oxygen and nitrogen, see picture above. When oxygen atoms are being ionized, emissions of photons results in brownish-red to green colors. Ionized nitrogen does emit blue to red colors. In the very top of the atmosphere the percentage of oxygen is thin, thus red aurora's are not often seen. Ionization of oxygen and nitrogen becomes more frequent in lower parts of the atmosphere resulting in a color differential with altitude. At high altitudes oxygen red dominates, then nitrogen blue and the more abundant oxygen green aurora's, and at lower altitudes the nitrogen pink to crimson/magenta aurora colors appear. Examples of the aurora color stratification are given in the three pictures below; from the left to the right are the aurora colors that dominate from high in the atmosphere to lower altitudes.
Solar winds & sun cycle
Solar winds do originate from density anomalies in the plasma of the outer layer of the sun, such as sunspots, coronal holes, solar flares and coronal mass ejections (CME). When the speed of solar winds are high enough they can 'ignite' the aurora's in the earth atmosphere. On average a geomagnetic storm, caused bij a solar wind shock wave, strikes the earth's magnetic field three to fours days after the event. This only happens if the shock wave is directed towards earth. Magnetic storms usually last 24 to 48 hours, but they may last for more than several days. From August 28 until September 2, 1859 a solar superstorm took place. Numerous sunspots and solar flares were observed at the sun with the largest solar flare occurring on September 1th. A massive CME due to a solar flare headed towards earth within a record time of eighteen hours. Aurora's were seen as far south as Hawaii, Mexico, Cuba and Italy. Another event took place on March the 9th, 1989 a CME caused a severe geomagnetic storm that hit earth at March the 13th. Aurora's were observed as far as the south of Texas. The geomagnetic storm caused the collapse of the Hydro-Quebec power grid in a matter of seconds and six million people were left without power for nine hours.
Sunspots and coronal holes do not always occur. Their occurrence is related to the solar magnetic activity cycle, or solar cycle, that has a period of about 11 years. The magnetic activity of the sun during a solar cycle is directly observed by counting the frequency and placement of sunspots visible at that part of the sun that is facing earth. When the sunspots are being plotted against latitude and time, it shows that during the solar cycle processes, sunspots appear first at mid-latitudes, and then closer and closer to the equator until solar minimum is reached. This pattern is also called the 'sunspot butterfly diagram', see below.
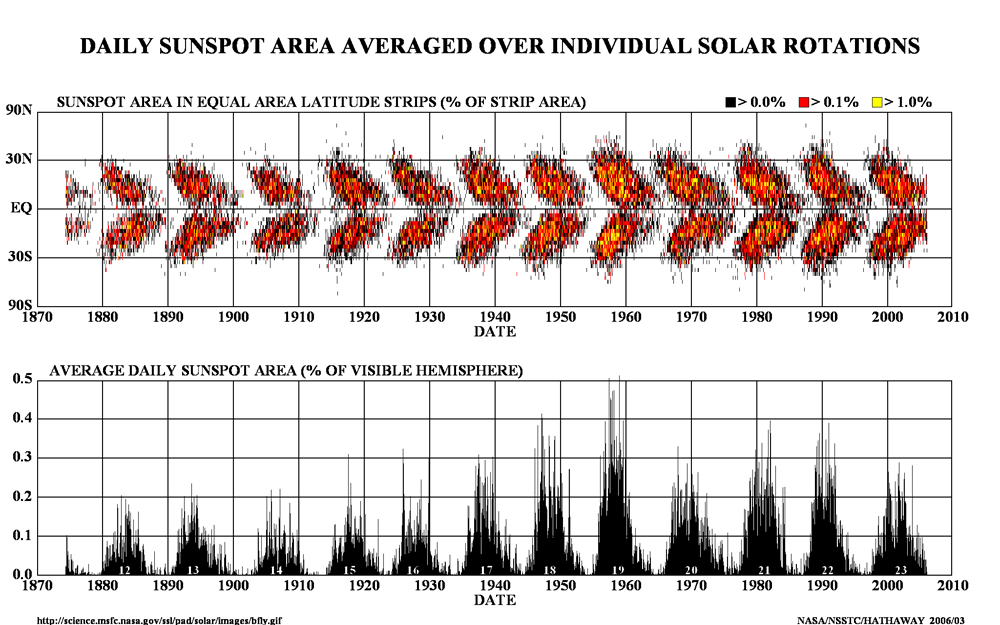
Source: Nasa
Apart from the use of sunspot observations for determining the solar cycles, long term fluctuations in the sun activity can be deduced from recordings of Carbon 14 and Beryllium 10 - and even before the time that the first sunspot observations were made. These long term fluctuations indicate four prolonged sunspot minima during the last thousand years that coincides with lower than average global temperatures. The last prolonged sunspot minimum is called the Maunder minimum that lasted from 1645 - 1715. During a period of 30 years within the Maunder minimum only 50 sunspots were observed, as opposed to a more typical 40.000–50.000 spots in modern times. The Maunder minimum coincided with the middle and coldest part of the Little Ice age. During this period Europe and North America experienced cold winters and lower yearly average temperatures. From the frequency of these prolonged sunspot minima in the past, it is not unlikely that another prolonged sunspot minima can be expected soon.
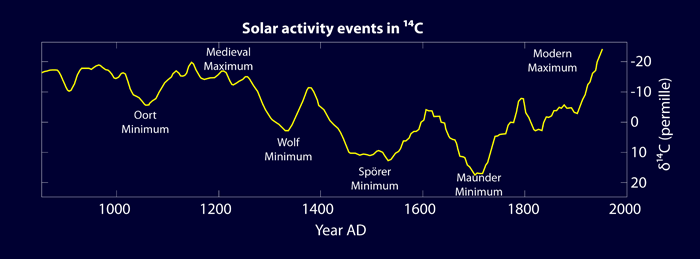
Source: Reimer et al., 2004.
References
Reimer, P.J., et.al.,(2004), INTCAL04 terrestrial radiocarbon age calibration, 0-26 kyr BP, Radiocarbon, Vol. 46, Nr.3, pp. 1029-1058. Ref1: http://www.natuurkunde.cjb.net/uitleg.php